

A slow page can lose a customer before the application gets a chance to do its job. Google also uses Core Web Vitals within its page-experience systems. That makes performance a ranking input, not a promise that one faster page will outrank another or that a Lighthouse score will reduce advertising costs.
We've previously written about Google's Web Vitals. The practical question is where the real-world data comes from. It is not gathered by Googlebot. Google uses field data from the Chrome User Experience Report, usually shortened to CrUX, to show how eligible Chrome users actually experienced a page or origin.
That matters because a fast lab score is not the same thing as a fast customer experience. WebPageTest and Lighthouse help diagnose a controlled test run. CrUX shows the field data behind PageSpeed Insights, Search Console's Core Web Vitals report, and Peakhour's website speed comparison tool.
Introducing the Chrome UX Report (CRuX)
The CrUX report is a public data set of real-user measurements (RUM) of website performance across millions of sites. The report has been around since 2017 and is updated regularly, but the value is still often missed: it shows what real users experienced, not what a synthetic test predicted.
The data is collected from real Chrome browser users who have opted in to send browsing information back to Google. This opt-in requires that the user has:
- Opted in to syncing browser history
- Not set up a sync passphrase
- Usage statistic reporting enabled
Despite these conditions, millions of Chrome users still report statistics back to Google. A given website still needs to be fairly busy before there are useful statistics in the report.
Gathered Metrics
The current Core Web Vitals are:
- Largest Contentful Paint (LCP): how quickly the main content appears.
- Interaction to Next Paint (INP): how responsive the page is to real user interactions.
- Cumulative Layout Shift (CLS): how visually stable the page is while it loads.
CrUX also exposes supporting performance metrics and dimensions that help explain those headline scores. Older metrics such as First Input Delay (FID) still appear in older reports and tools, but INP is now the responsiveness metric to watch.
Dimensions
Because performance can vary widely, the metrics are divided into the following dimensions to help segment and understand the user experience.
- Country
- Device Type: Tablet, Phone, Desktop
- Connection Speed: slow 2g, 2g, 3g, 4g, or offline
Viewing data in the report
There are several ways to see how your website performs in the report. These include:
Pagespeed insights
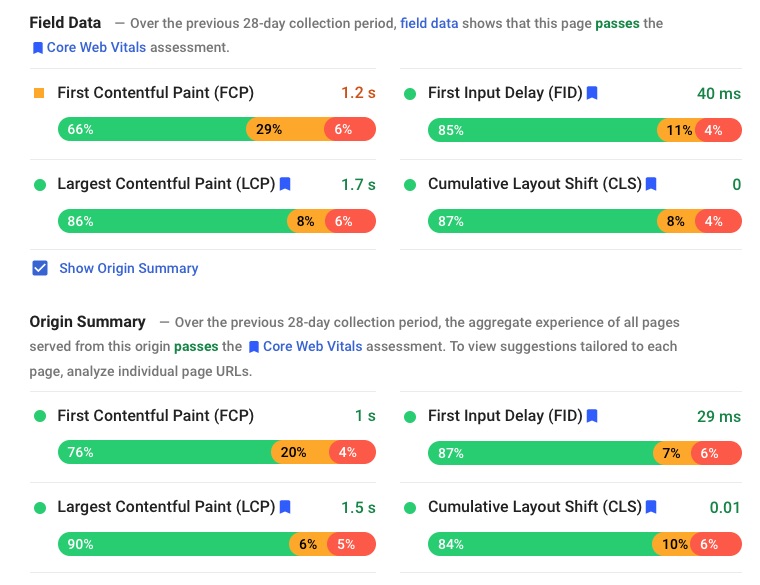
Google's website analysis tool provides summary CRuX data for the analysed URL and, if data is available, for the entire site.
 Page Speed Insights Field Data" style="max-width: 100%;margin-bottom: 20px"/>
Google BigQuery
The most flexible option is to access it directly via BigQuery. You query it with SQL (database query language).
The downside is that you need to understand SQL and have a Google account.
Google's Search Console (formerly Webmaster Tools)
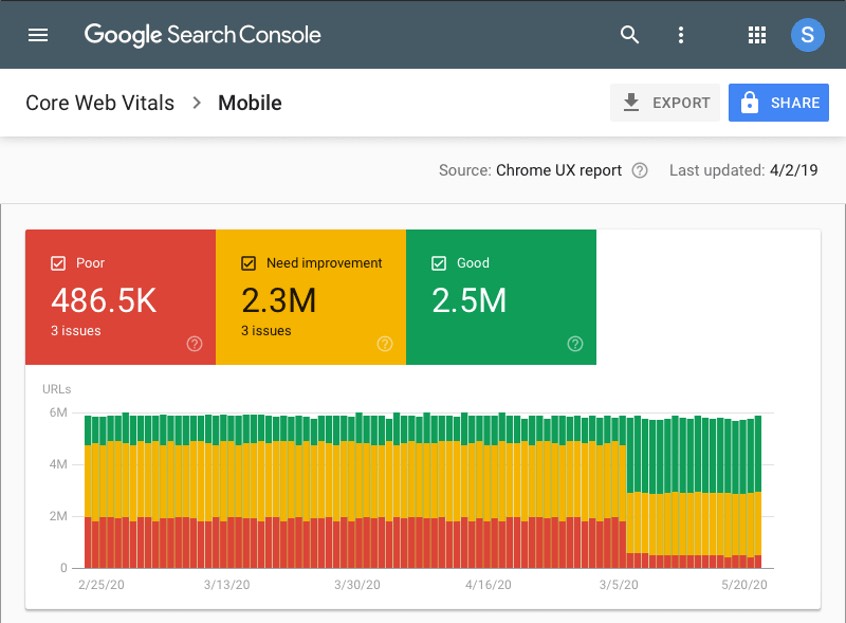
The search console now has a section 'Core Web Vitals' that shows whether URLs pass the Core Web Vitals, as well as a historical graph of performance for both mobile and desktop.
Looker Studio
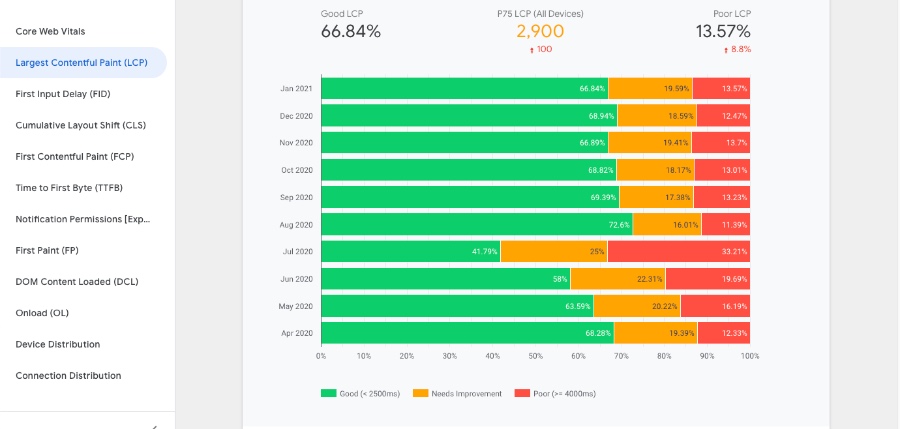
Looker Studio, formerly Google Data Studio, can be used to build dashboards on top of CrUX data and other sources. It lets you visualise the performance of your website, or a competitor's website, over time.
Third party tools
Like our own website speed comparison tool. It uses the Chrome UX API to retrieve the information.
CrUX vs lab tools vs RUM
CrUX is field data. It is useful because it reflects real Chrome users, but it only reports where there is enough eligible traffic. It can also be slower to reveal the cause of a problem because it is aggregated.
Lab tools such as WebPageTest are better for diagnosis. They show waterfalls, redirects, blocked resources, caching issues, image weight, and third-party requests. Your own real user monitoring can go further again, because it can include business context that CrUX does not know: customer type, template, campaign, cache state, bot pressure, origin load, and release timing.
Put field data beside the release
The data in the Chrome UX Report is one of the clearest public views of how Google sees the performance of your website. It is also a free source of real-world user measurements that helps you understand how visitors experience your pages.
Use CrUX to see whether your site is passing Core Web Vitals, use lab tools to find the technical cause, and use traffic visibility to understand whether bots, crawlers, bursts, cache misses, or expensive requests are putting the experience under pressure. If the first question is "how do we compare?", start with the website speed comparison tool. If the question is "what is slowing us down?", start with Traffic Management.